Quick Start Guide Polysun
In only 8 Steps our quick start guide shows you to map and dynamically design your first project in Polysun. We demonstrate this using the concrete example of a multi-family building. This guide is ideal for getting to know Polysun and at the same time forms the basis for larger projects with multiple generators, sources and project-specific control strategies.
Table of contents
- Selecting a suitable template and creating a project
- Entering the location data
- Entering the building heating load and heating energy demand
- Entering or importing the domestic hot water demand
- Selecting the heat pump and sizing additional heat generators
- Selecting and sizing the energy storage tanks
- Simulation and analysis of the results
- Creating systems and optimization
In addition to the step-by-step guide below, a video tutorial is also available
Selecting a suitable template and creating a project
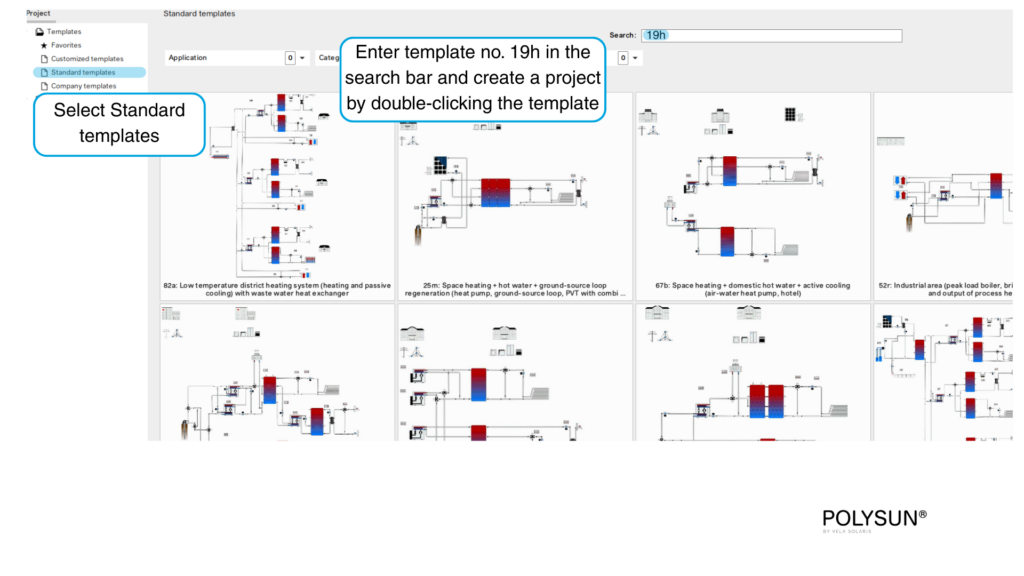
Select the standard template “19h”. Double-click the template to open a new project. Give the project a name. A project can contain several system diagram variants and includes assigned location data.

Practical Tip
Right click a standard template to add it to your favorites. You can also convert a system diagram into a customized template by right-clicking the system diagram in the project area.
Entering the location data
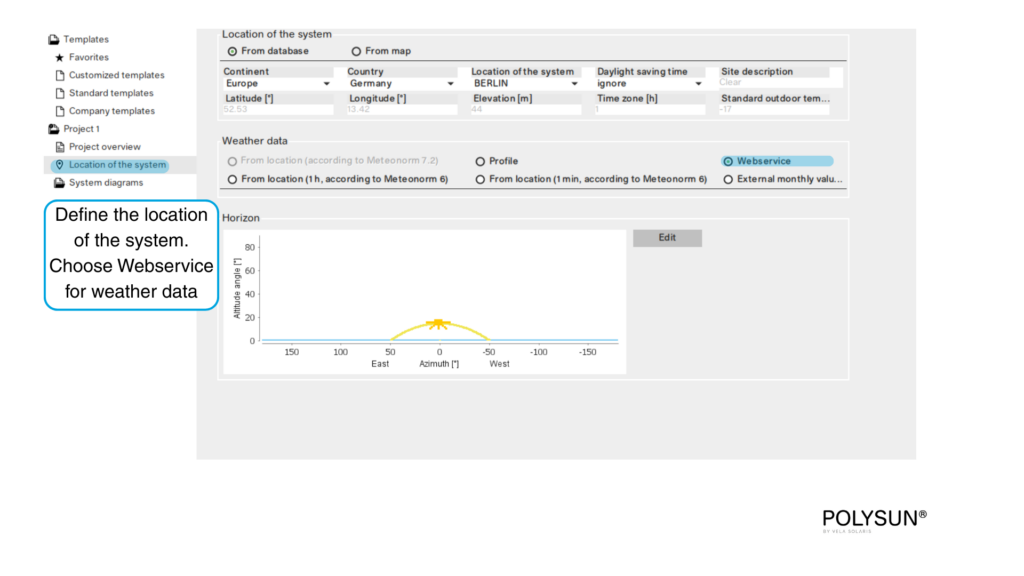
In the Project Overview section, you can add a more detailed description of your project and its system diagrams for the project report. Select the location of the system either from a database or from a map.
Practical Tip
Meteonorm 6 contains locally stored data location data. These are only selected when the user is offline or has access to the webservice. The webservice contains the most up-to-date weather data via the API.
Entering the building heating load and heating energy demand
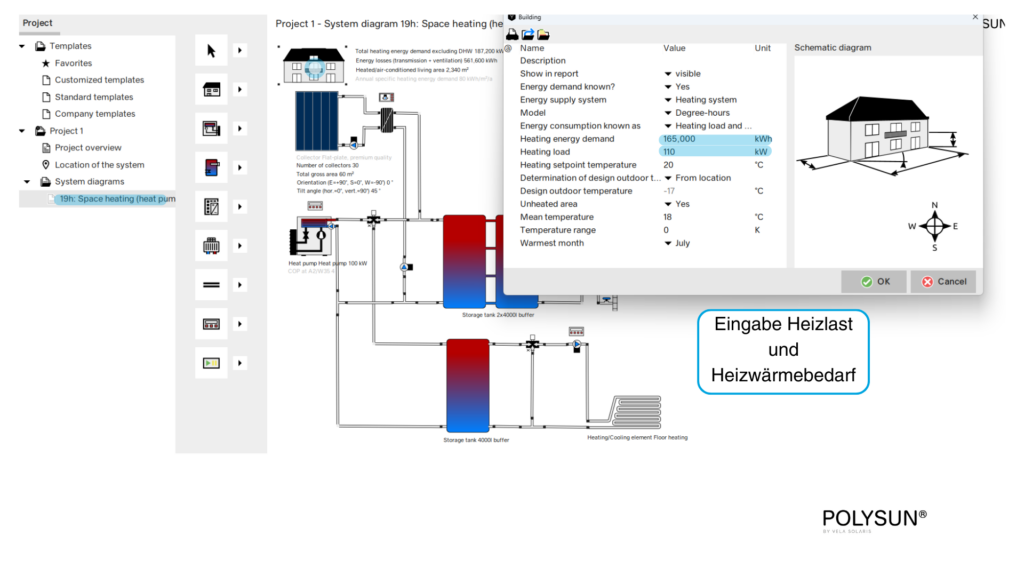
On the left side, click the system diagram and double-click the building. Define the heat demand of your building, in this case a multi-family building, using the most common method, via heating load and heating energy demand.
In Polysun, however, the building energy demand can be entered in several ways, as explained in the practical tip below.
Practical Tip
Depending on the available data and planning stage, three additional approaches are available for modeling the building energy demand in Polysun:
1. Planning based on heating load and heating demand
Based on measured consumption data or existing calculations, you can use the heating load and heating demand directly to define the building’s heat consumption.
→ Degree hour Model
Recommendation: Fast and reliable for refurbishments and preliminary studies.
2. Import of external building simulation
For higher accuracy, the building can first be simulated using external software (e.g. EnergyPlus, IDA ICE) the load profiles are then imported into Polysun using the hourly energy demand.
Recommendation: Precise and efficient approach for specialist planners in complex projects.
3. Internal building models in Polysun
For early planning stages, three models are available:
- Degree-hour model (simplified estimation)
- Quasi-dynamic building model
- Dynamic model
Guideline: Choose the model according to the planning stage and data availability.
Entering or importing the domestic hot water demand
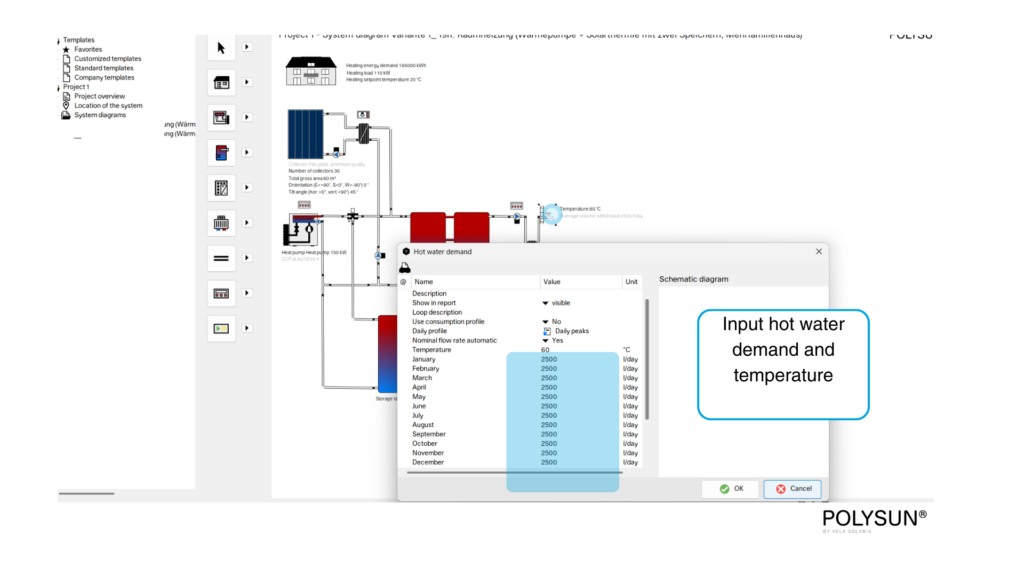
The domestic hot water demand of the multi-family building can be defined by double-clicking the hot water tap. The most common method is already pre-set: Entry using daily consumption in liters per day (l/d). A detailed guide can be found under Domestic hot water.
Selecting the heat pump and sizing additional heat generators
Once the consumption of heat and electrical energy has been defined, it can be covered throughout the year with the aid of a heat generator or power generator and a suitable control system. In preliminary projects, there are usually already supply ideas or even individual variants. In a first step, this rough variant can be calculated and mapped using rules of thumb, for example. Double-clicking on the heat generator opens the catalog for the respective heat generator. By scrolling to the right or expanding the window, all parameters of the respective heat generator can be viewed in the catalog.
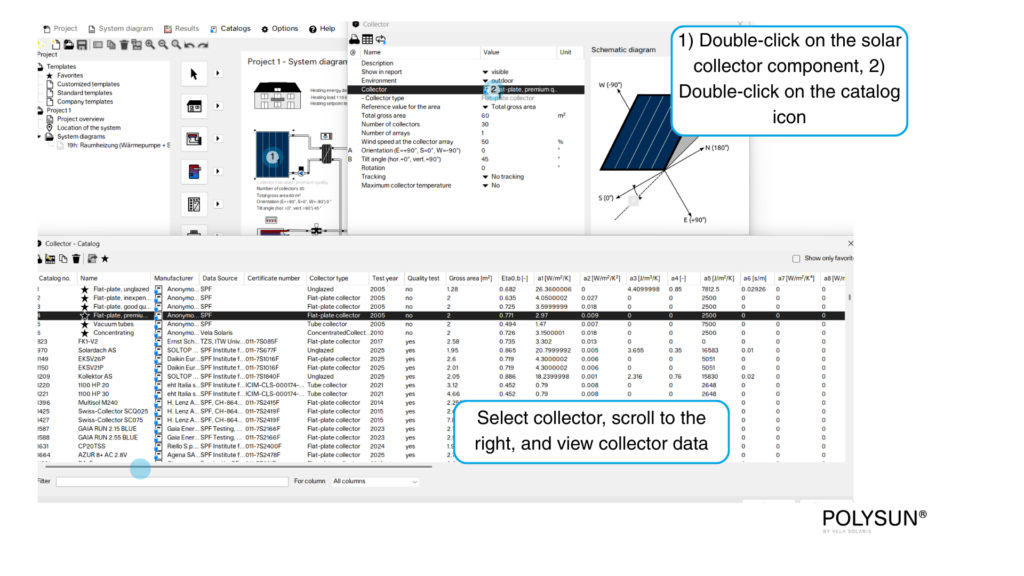
In our example of the apartment building, there are two heat generators: the air-water heat pump and the solar thermal collectors. By double-clicking on the respective component, you can configure its parameters as shown below. You can choose from a manufacturer’s catalog of heat pumps and solar thermal collectors.
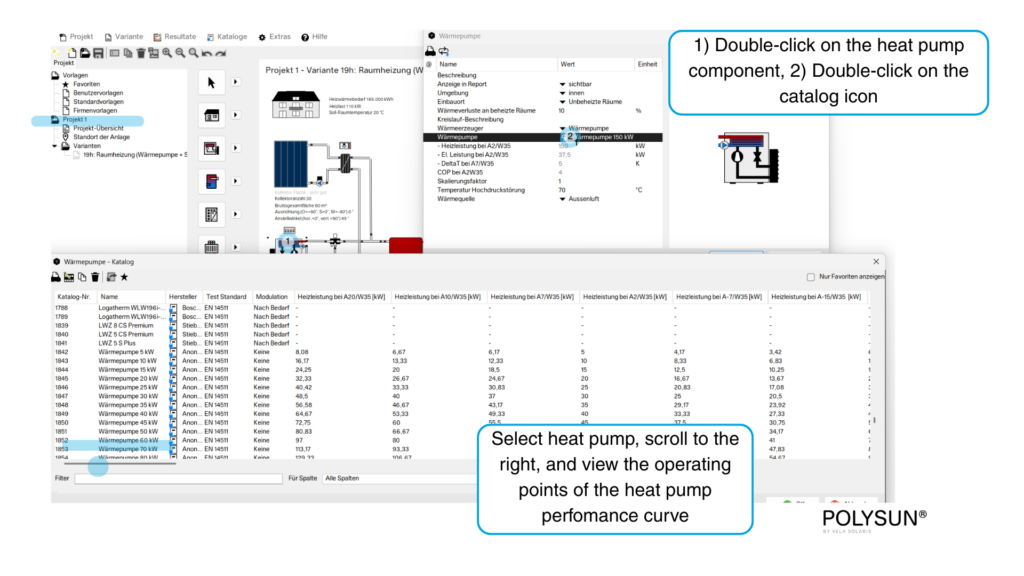
If the size and type of the heat pump are unknown, the generic profiles (e.g., manufacturer anonymous, 150 kW) from the catalog can be used. By scrolling to the right in the catalog, the operating points of the characteristic curve of the respective heat pump for heating capacity and electrical energy can be viewed. In the eighth step, this rough design variant can be optimized with different variants (e.g., size of the heat pump, size of the buffer storage tanks, control strategy).
Practical Tip
You can define your own heat pump and adjust operating points in the catalogue:
- Right-click the heat pump entry in the catalogue and copy it.
- Assign your own name and edit the performance curve.
If you want to simulate multi-family building without solar thermal, you can easily disable it:
Double-click “Solar circuit pump control” -> remove the availability times Monday to Sunday./
Selecting and sizing the energy storage tanks
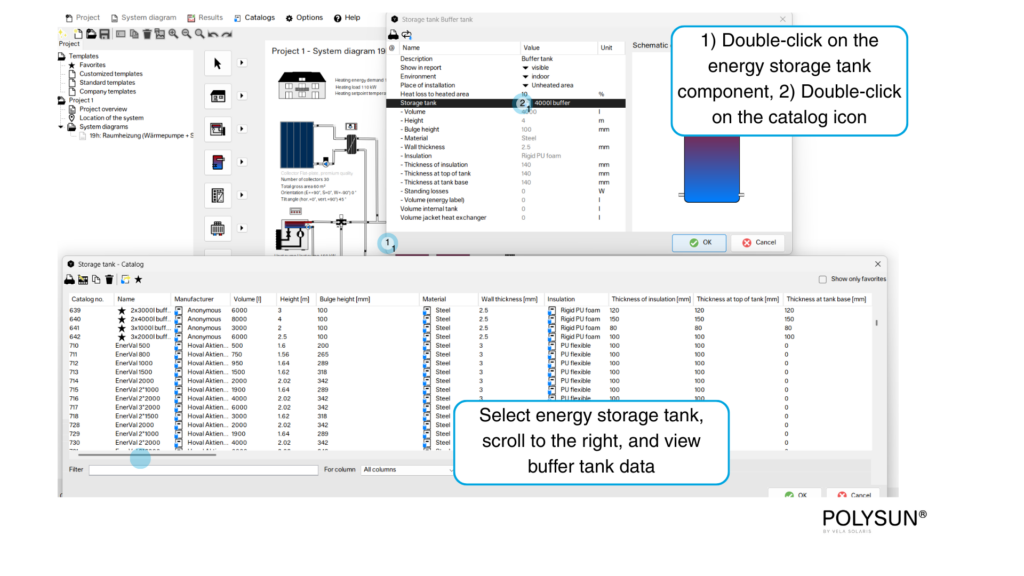
Energy storage tanks are often selected based on the available space. Double-click the respective tank and choose and parametrize it from the manufacturer catalogue. If no specific tank is known, generic storage tanks can be selected (e.g. manufacturer anonymous, 4000 l buffer tank).
Simulation and analysis of the results
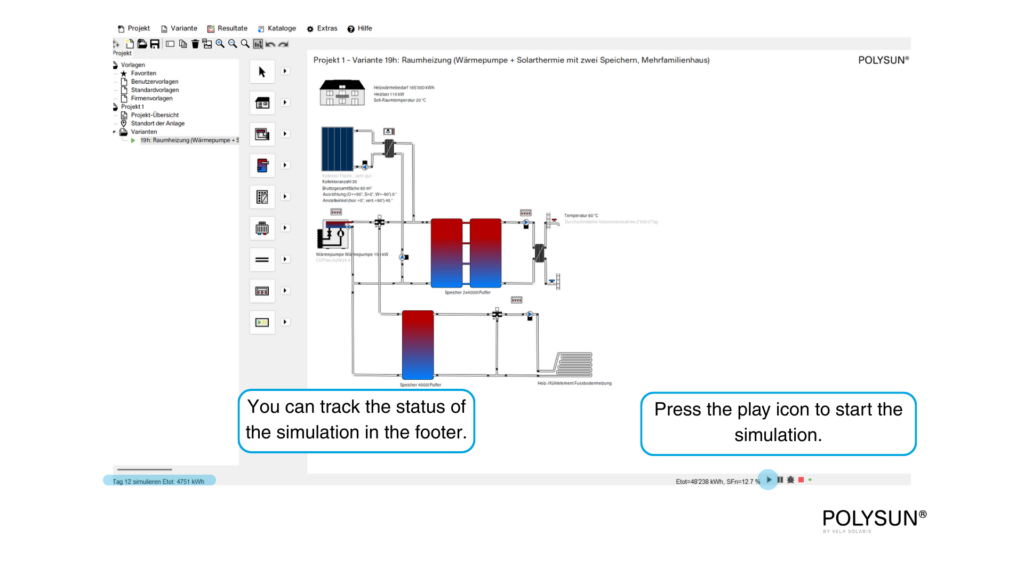
Once the consumers and generators are parametrized, start the simulation of the multi-family building by clicking the green Play button. The system is now dynamically simulated for every step over 365 days. The simulation status can be monitored in the footer.
After the simulation is complete, you receive an overview of the results with typical key performance indicators.
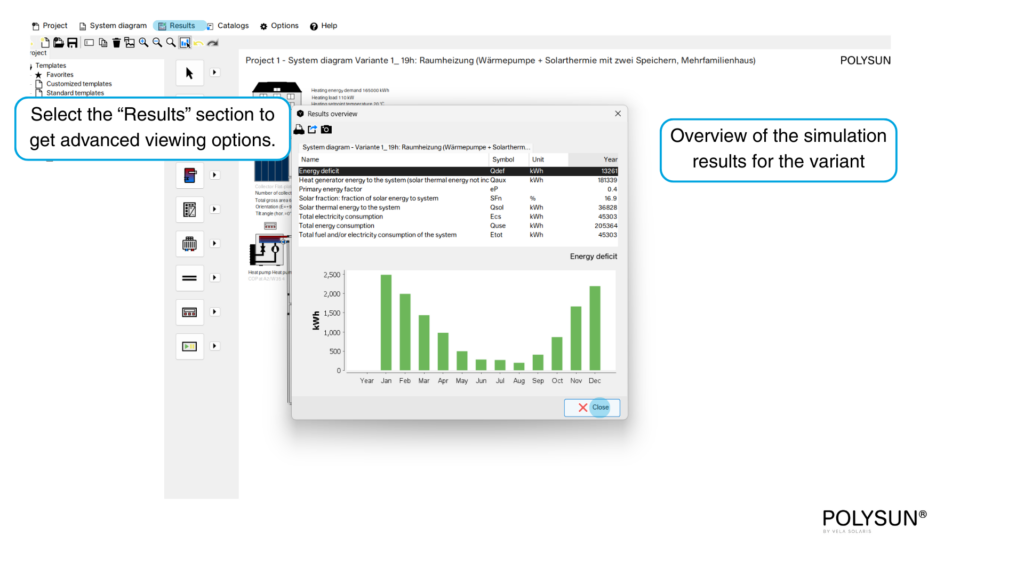
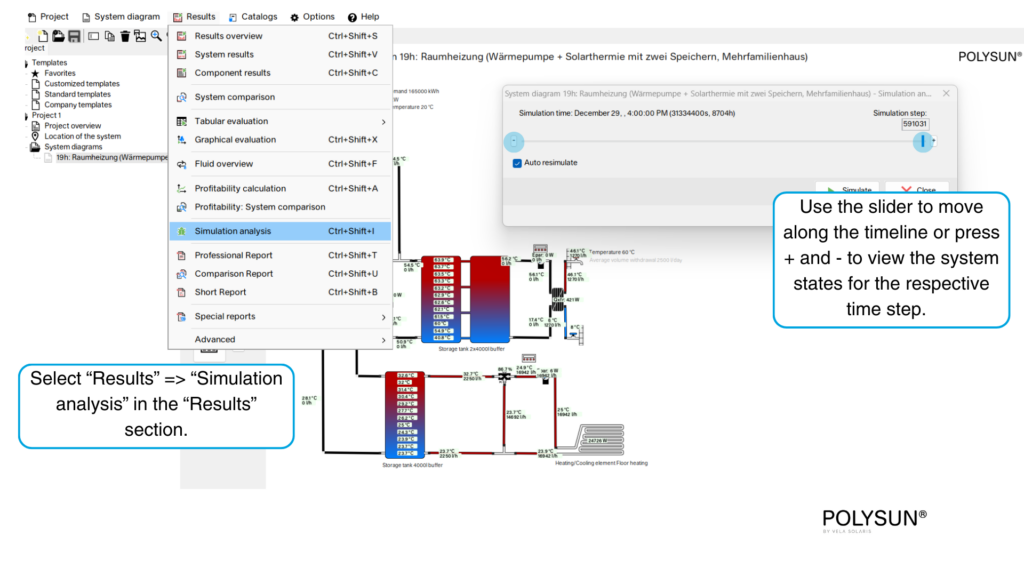
Under Results, you can analyze the simulation outcomes in more detail and generate project reports. Depending on the goals, different views are available. A good starting point for analysis includes:
- System results: Shows the key indicators of the system per month
- Component results: shows the parameter trends of each component per month
- Simulation analysis: shows the system states for each simulation time step
Creating systems and optimization
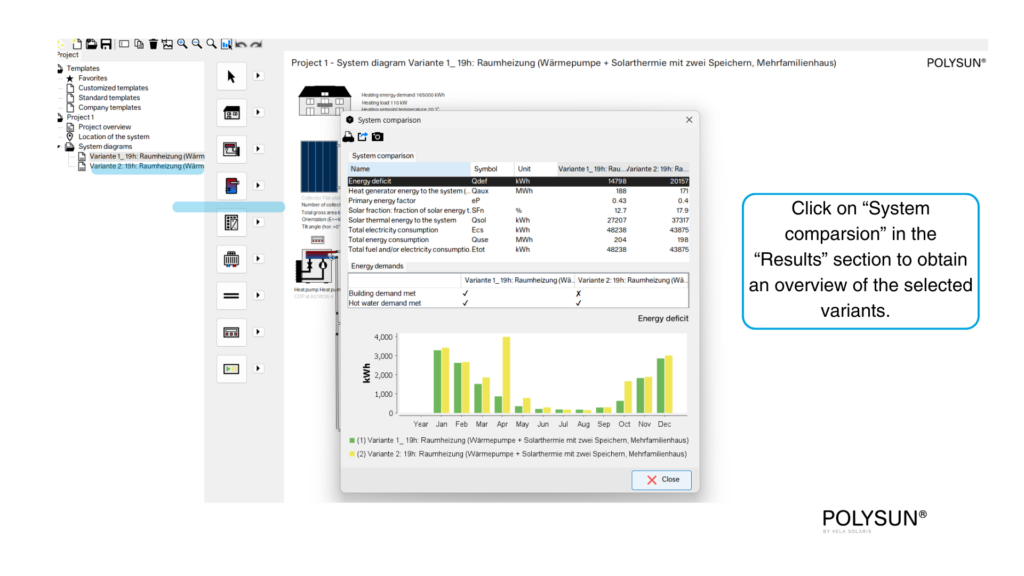
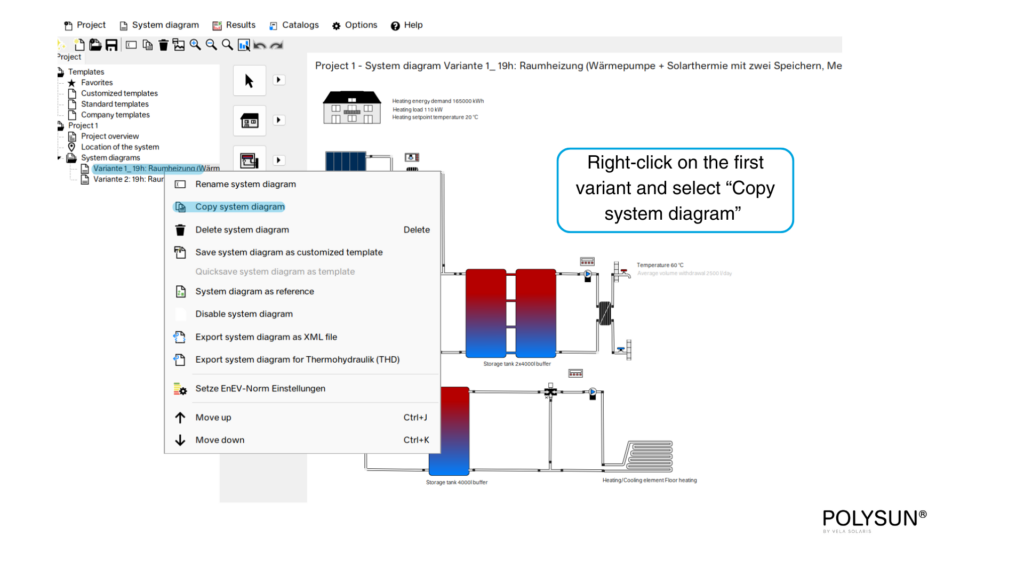
Right-click the first system diagram to copy the original system diagram of the multi-family building. You can optimize the system based on the insights gained from analyzing the results and create a new system diagram.
Using the System comparison report in the results section, the individual system diagrams can be compared in order to identify the optimal energy supply solution for your project.