Your first project in Polysun SPT
To start a new project in Polysun SPT, click on “Create new project” in the menu bar.
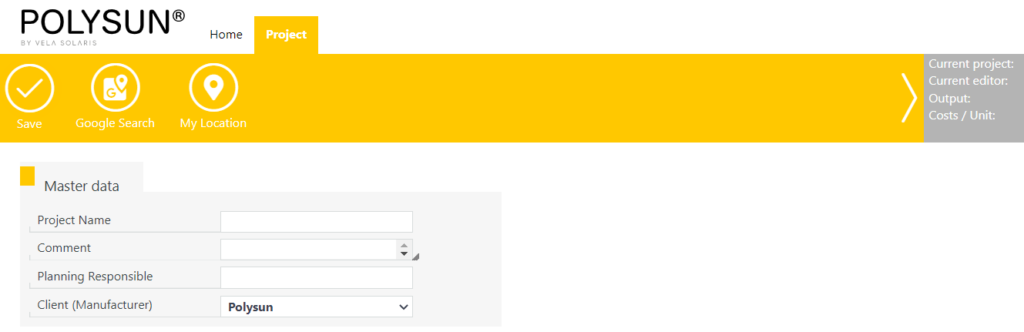
You are now automatically in the project editor. Here you can enter master data, project and delivery address. When you click on “Save”, you will automatically be redirected to the roof editor.
Roof editor
In the roof editor you can choose from eight different roof shapes:
- Gable roof
- Hip roof
- Half-Hipped roof
- Pavilion roof
- Shed roof
- Flat roof (elevation)
- Customized
- Custom(Elev.)
- Facade
The “Customized” and “Customized (elevation)” roof shapes can be configured flexibly, for example by drawing on a satellite image or by importing a 2D drawing.
If you have selected a roof shape of the type “Customized”, the option “Draw / Import” appears there.
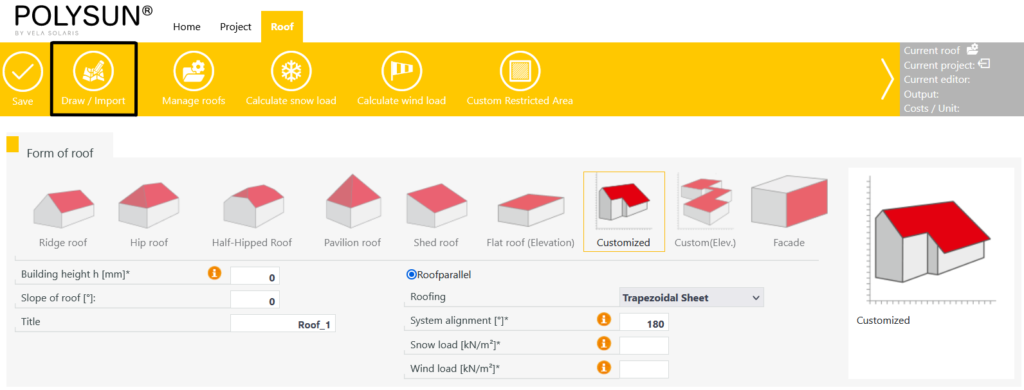
First, completely fill in the input options in the roof shape. These include:
- Building height
- Slop of roof
- Snow load
- Wind load
If you click on “Draw / Import”, a new window will open. There you can
- draw a roof based on satellite images, e.g. Google Maps
- import a graphic, e.g. a roof plan or an aerial photo and draw a roof based on this graphic
- import a 2D drawing
Draw a roof
Video: Polysun SPT – Using the Draw Import function
Tools:
- Guideline

- Draw

- Ridge

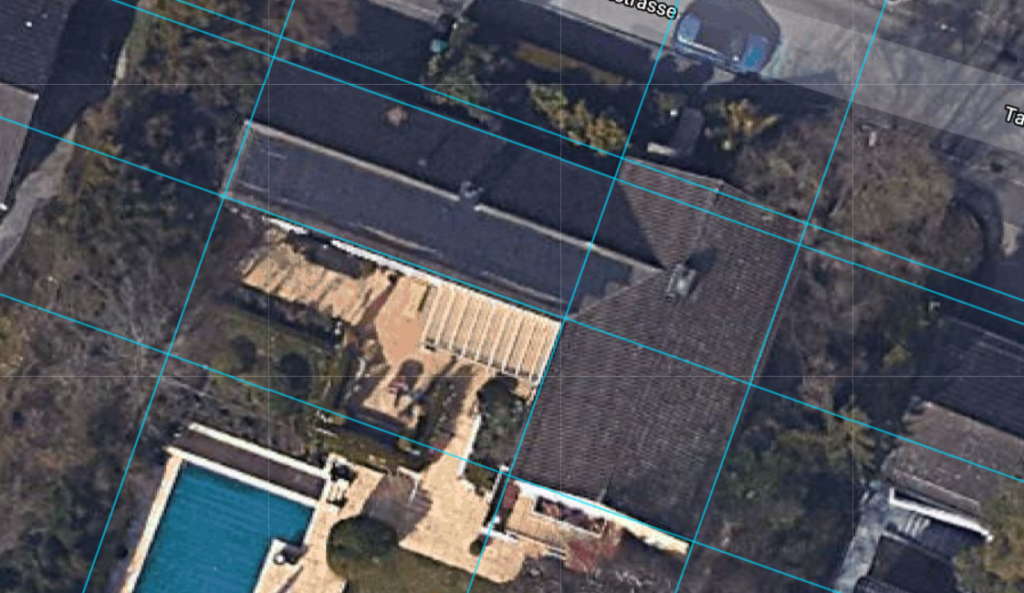
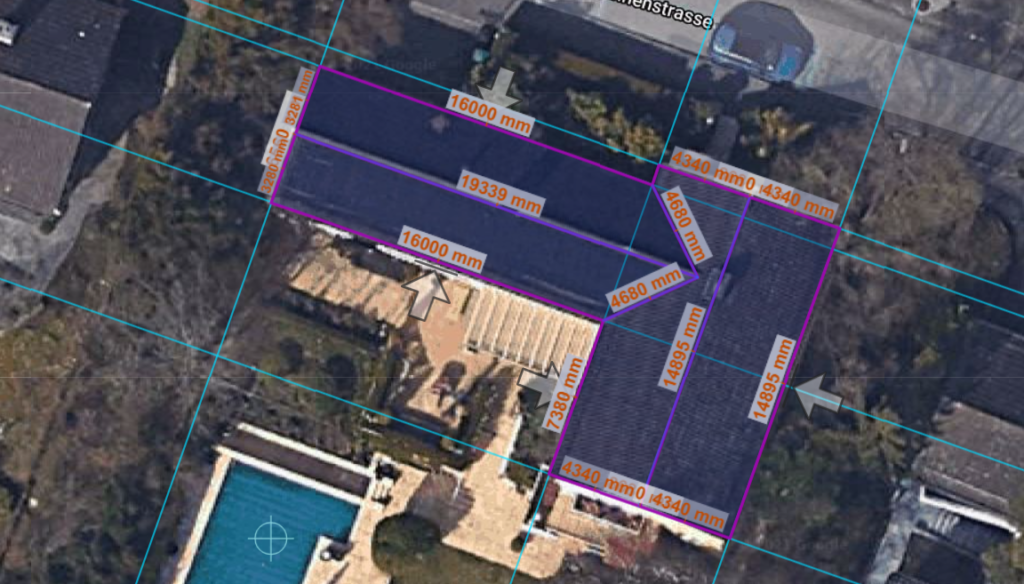
Start by drawing guidelines with the guideline tool. If you draw a larger number of guidelines, this makes it easier to draw the roof. By holding down the Shift key, you can orient new lines relative to existing guides.
When drawing, pay attention to rectangular lines and ignore possible distortions of the satellite image.
In the next step, use the drawing tool to draw the roof along the existing guidelines. To do this, click on the pencil icon and select the “Polygon” (Free form) option. Then, using the autosnap feature, draw the outline of the roof at the intersection points of the guide. As soon as it is completely drawn in, the enclosed area is displayed in a dark color.
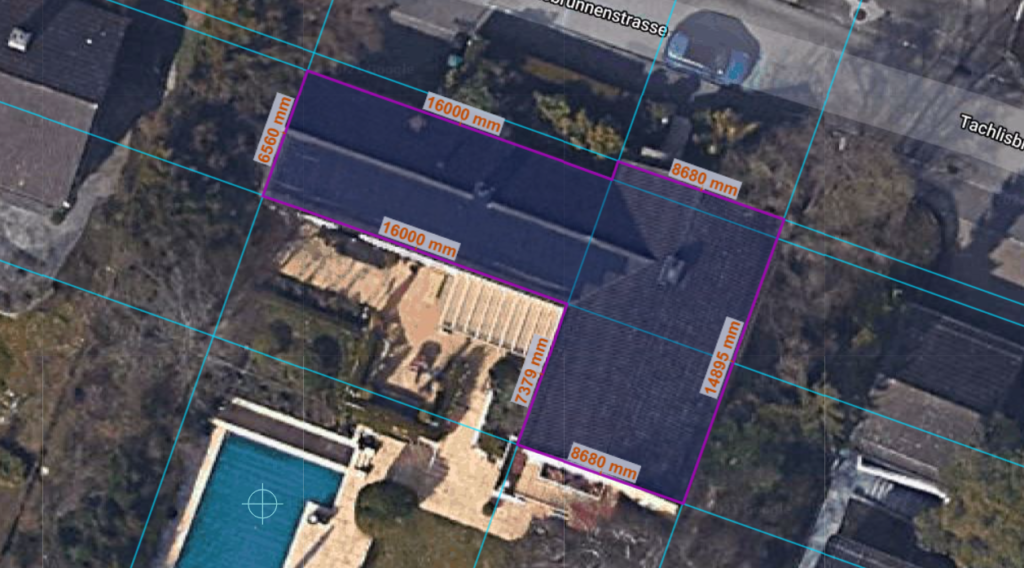
In the next step, you can use the ridge tool to draw the ridges. To do so, hold down the Shift key to orient the drawing on the existing guidelines. You can also use the auto snap feature to snap to the center of a roof edge. Click the Escape key to interrupt the drawing process temporarily.
During the drawing process, Polysun automatically suggests possible ridge lines. Keep drawing ridge lines until all automatic suggestions have either disappeared or been overdrawn. Once the ridges are completely drawn, Polysun will use arrows to symbolize the orientation of the modules. Click Save to apply the roof.
Click Save in the roof editor to go to the next step. Polysun asks if you want to apply the setting to all roofs. Select “All roofs”. You now find yourself in the PV-Module selection.
PV modules
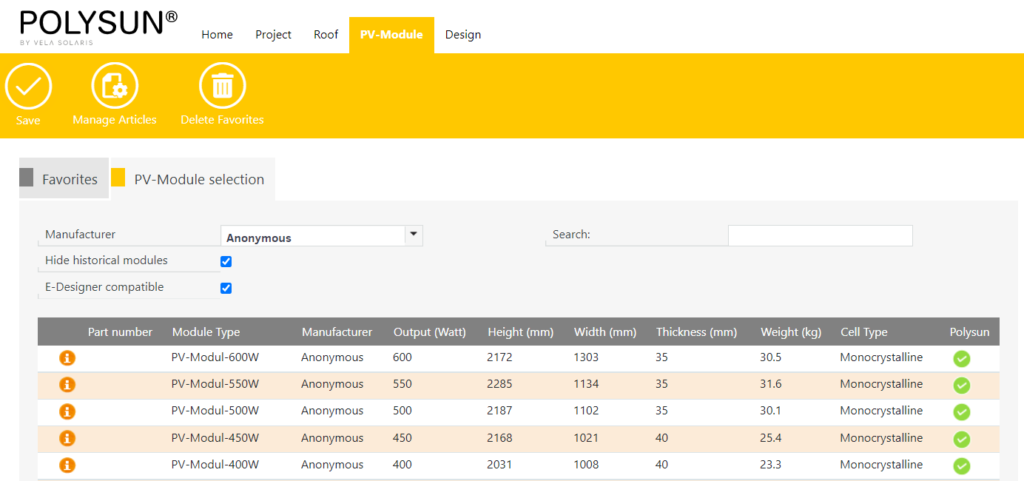
In the PV module catalog you have the possibility to select from a large database.
After you have selected a manufacturer, you can select the module that suits you. By clicking on the info sign you will get more information about the module. Already used modules are automatically listed under “Favorites”.
After you have clicked on Save you will get to the next step: The design.
Design
In this menu you can select a generic fastening system for your application. If you also save this step, you will get to the “Position” tab.
Position
In the position tab, you have the option of repositioning modules and drawing interference objects and surfaces. Here you can also see a 3D visualization of your building.
For the next step, use the menu bar at the top of the screen and click directly on E-Designer to plan an energy simulation for your building.
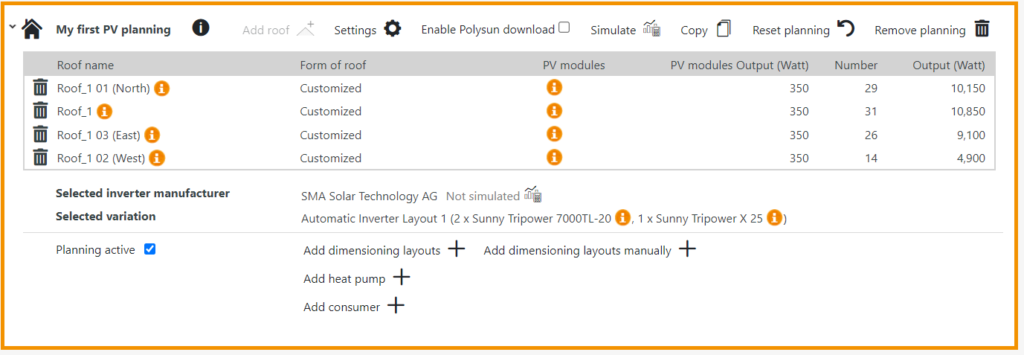
E-Designer
First click on “Add planning”. You have now created your first planning and can rename it.
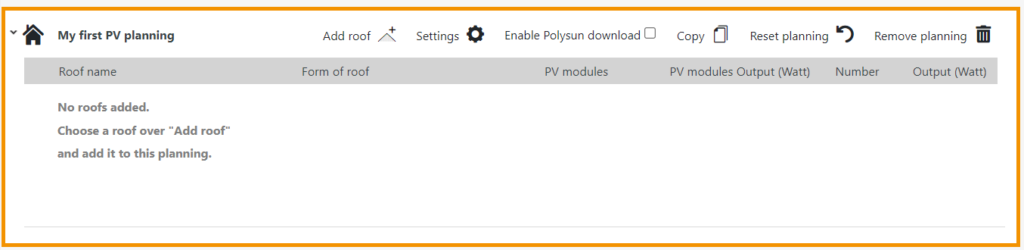
You can now add roof areas to this planning to add the placed PV modules to the planning. To do this, click on “Add roof” and select “Add all roofs”.
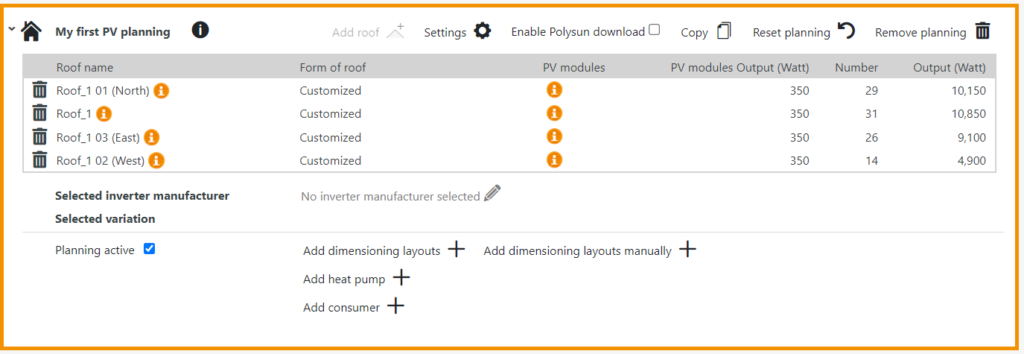
In the next step, you must add an inverter design variant to your planning. To do this, click on “Add design variant”.
This opens another menu. First enter a name of an inverter manufacturer here. Then the inverters stored in the database will be displayed. By default, all available inverters are selected. You can limit the selection by deselecting individual inverters.
Then click on “Calculate design variants” to have Polysun suggest a suitable design. Confirm this design variant with “Accept design variants”. The design is now displayed in the planning.
Video: Invertersetup in Polysun SPT – automatic and manual
You now have the option to add the following components to the planning:
- a consumer
- a battery
- an electric vehicle
- a heat pump
To add a battery or an electric vehicle, you must first have added a consumer. In our case, we do not add any more elements to the planning and click on “Simulate”. After a short simulation time the results are available for you. You can now create a report directly using the “Project report” function from the top menu ribbon.
Furthermore, you can evaluate the results via the left menu panel. Here you have the following options for displaying the results:
- Yield values
- Energy balance per year
- Graphic output
- Energy flow diagram
If you want to further optimize your planning at this point, you can, for example, jump back to the Position tab and change the placement of the modules there.
When you are satisfied with your planning, you can create a string plan in the Electric tab or/and perform an economic analysis in the economic tab.
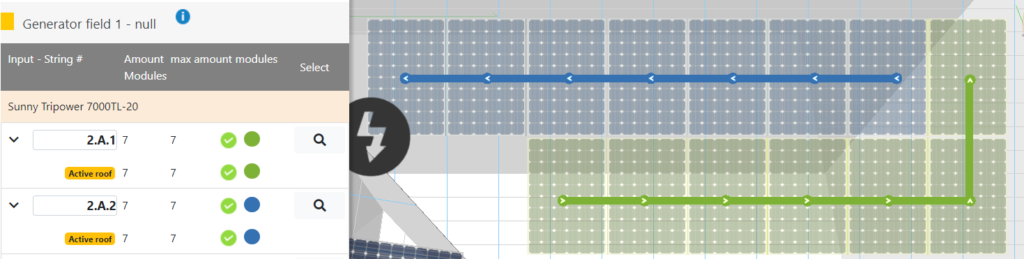
Electric
In the Electric tab, you have the option of creating a string plan manually or automatically. To create the string plan automatically, click on “Horizontal” or “Vertical”. Depending on the selection, the modules are connected either horizontally or vertically. Perform this step for each roof area. To move to another roof area, double-click on it.
You now have the option to export the string diagram, e.g. as a pdf.
Furthermore, you can configure the settings for the circuit diagram in the Electric tab. The basic prerequisite for this is that you have previously created a planning in the E-Designer, simulated it and created a string plan in the Electric tab. The circuit diagram is currently only available in German.
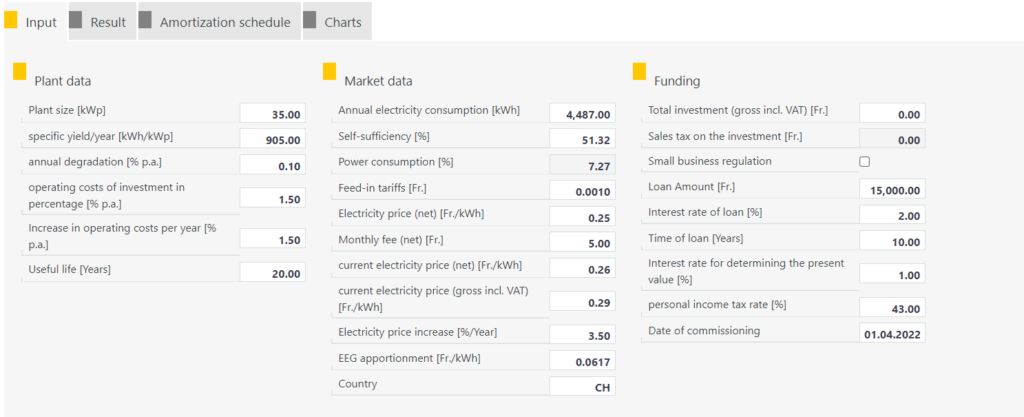
Economy
The system data is automatically loaded from the planning. Data such as the system size in kWp, the specific yield per year in kWh/kWp and, if applicable, the self-consumption are relevant for the economic efficiency. You can now add further data to the analysis, such as the total investment amount and financing data.
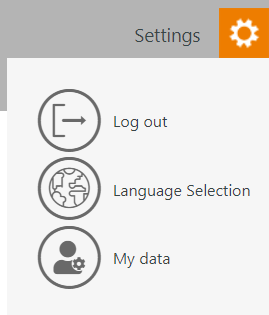
Entering the master data and configuring the project report
You can enter your master data via “Settings”. These are displayed in the project report. Furthermore, you can freely adjust the imprint field in the lower area of the first page of the report there. To do this, change the text in the upper freely editable text field.
Output
Once you have completely configured your project, you can create a project report in the “Output” tab. To do this, click on “Project Report” and select the information relevant to you. Then click on Project Report to output the report as a pdf.
Congratulations on your first project!