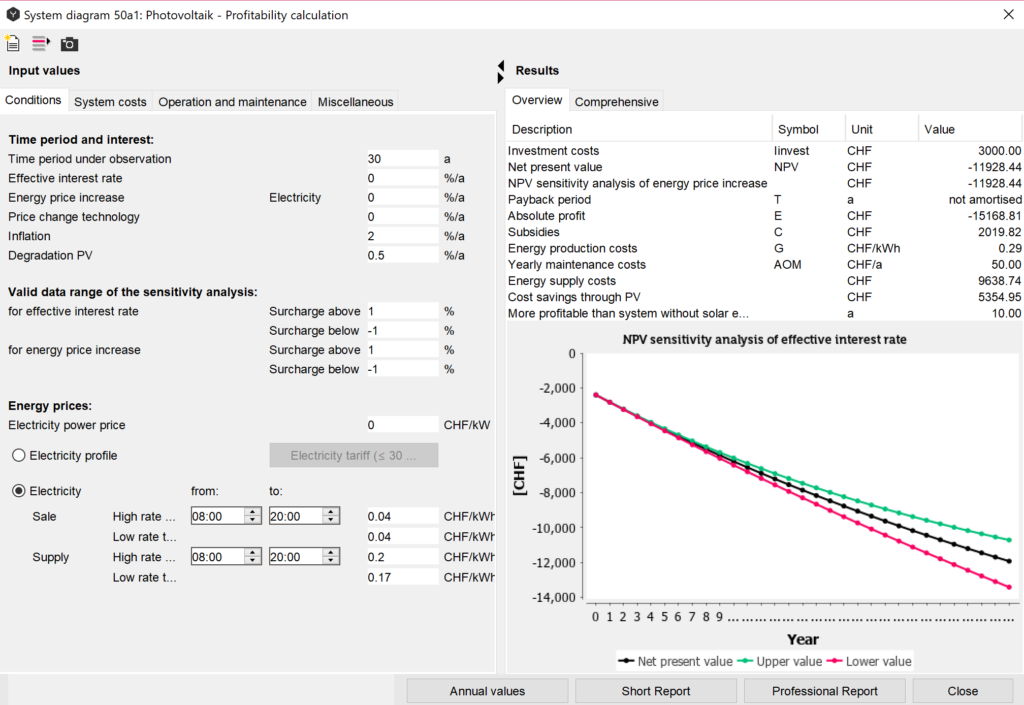
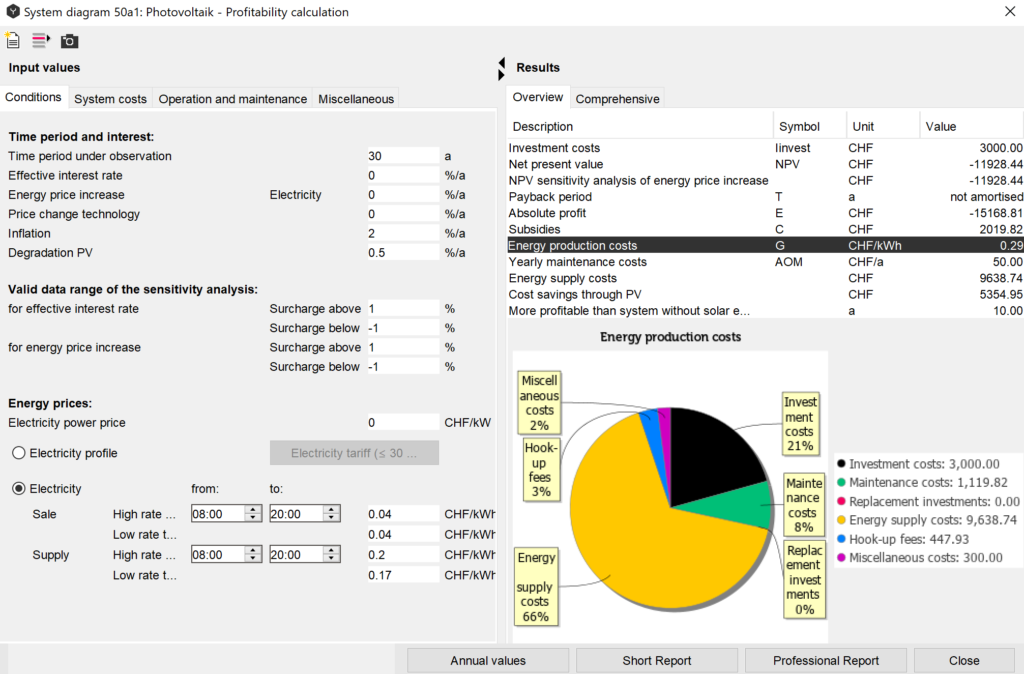
Results
In the input field, the results are divided in the chapters “Overview” and “Comprehensive”. In the overview chapter, the most important results are presented as a table. For these results, Polysun also offers you charts which can be accessed by clicking on the respective line. In the “Comprehensive” chapter, these results are amended by further results.
The overview of annual values is available in the bottom of the “Profitability calculation” dialog window as shown in the figure below.
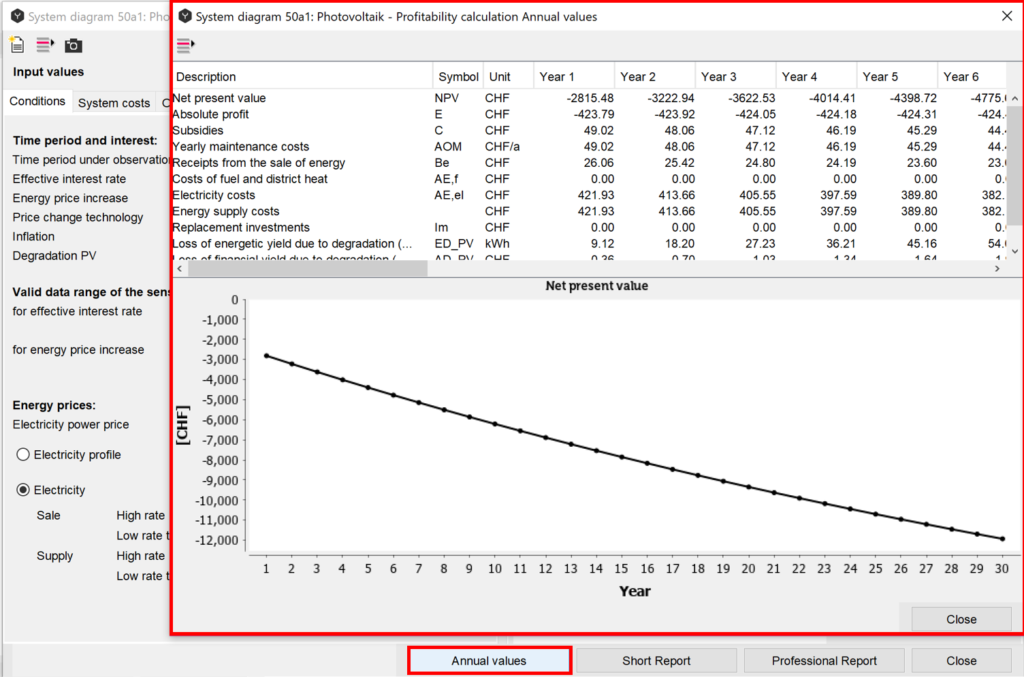
The overview shows the most important values and some additional parameters, which may be important for the economic feasibility estimation, such as:
- Receipts from the sale of energy;
- Cost of fuel and district heating;
- Electricity costs;
- Replacement investments;
- Loss of energy yield due to degradation (PV only);
- Loss of financial yield due to degradation (PV only);
- Annual cash flows;
For each parameter, the values for every year of operation as well as the graphical representation are shown under the comparison table.
Profitability: System Comparison
Polysun enables you to conduct both technical and economic analysis of energy projects. Implementation of the PV energy systems is often based on the economical evaluation. Profitability comparison feature in Polysun simplifies your decision-making. The economic comparison gives you an extensive overview about the main economic parameters over a year of the active designed system diagrams in the given project in comparison to the reference one. In order to assess the summary of the economic parameters in tabular and graphical form the “profitability comparison” can be found in the Polysun Results menu bar. The comparison table includes such parameters as investment cost, NPV, absolute profit, subsidies, energy production costs, yearly maintenance costs, energy supply costs, payback period comparison. The definition of the abovementioned parameters can be found in chapter Profitability terms and Formulas for calculation. Based on the values given in the table, the decision can be made which system is the most economically viable and therefore the most beneficial for the owner. The result window of the profitability comparison is shown in the figure below.
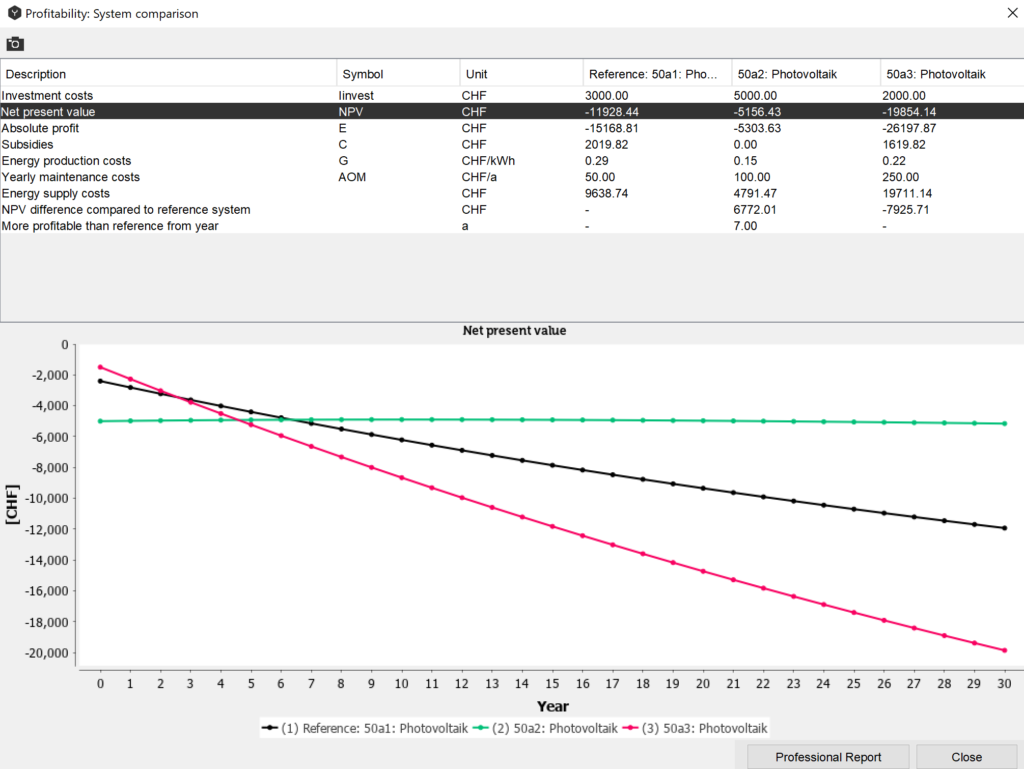
By left-clicking on the correspondent parameter the values over the year will be visualized on the graph. The graph shows profitability comparison only for the chosen system diagrams.
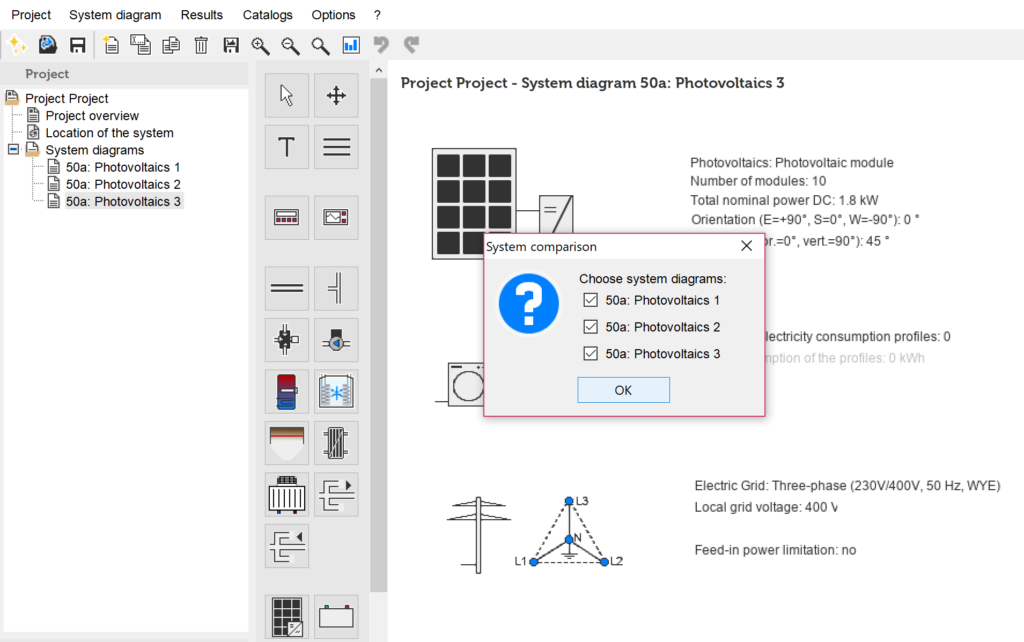
In order to create a report containing comparison data, at least two system diagrams are required. Maximum 6 active system diagrams can be compared. The procedure is as follows:
- Copy the variant you want to use for comparison (right-click on the variant in the project tree → copy system diagram) and make the desired modification in the copied variant. Alternatively, you can add another variant from the template database to the project tree (left-click on the template in the template folder).
- Mark one system diagram as the reference (right-click on it in the project tree → set system diagram as a reference). If no reference system is set, the first system in the project will be used as a reference for comparison.
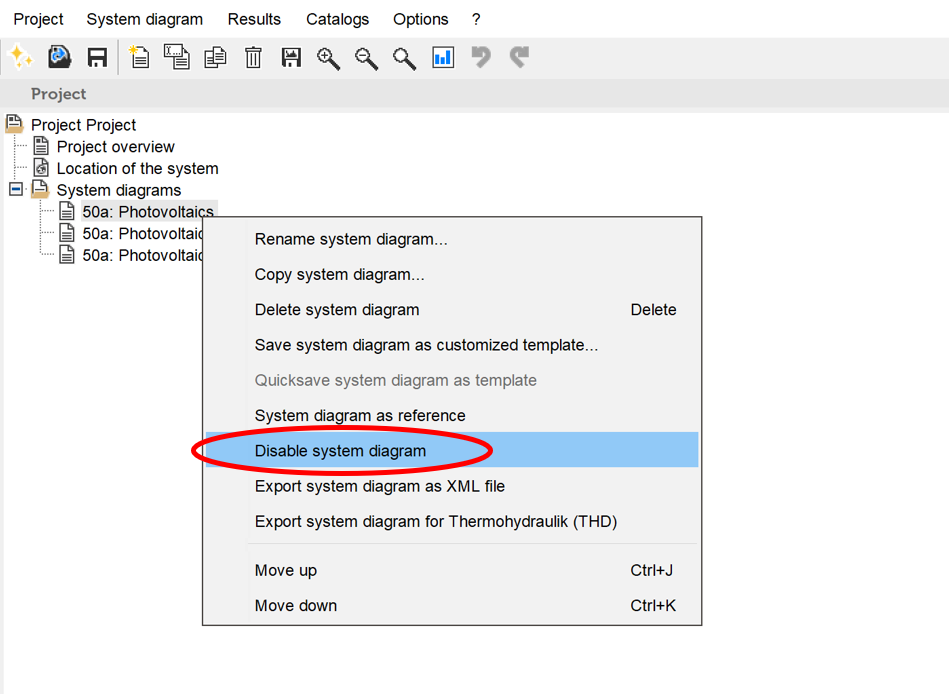
- The system diagram can be activated or deactivated as well as set as a reference by right-clicking on it (Fig. XX). Another option is to choose the particular systems, which are to be compared in the dialog window. The correspondent dialog window appears after choosing “Results” → “Profitability: system comparison” from the Polysun Menu Bar.
- Select the original system diagram and start the report.
The profitability comparison professional report can be easily generated for by clicking on the correspondent tab in the bottom of the dialog window. System diagrams, result comparison table as well as graphs for such parameters as NPV, investment costs and energy supply are presented within a single document.