Energy Flow Diagram
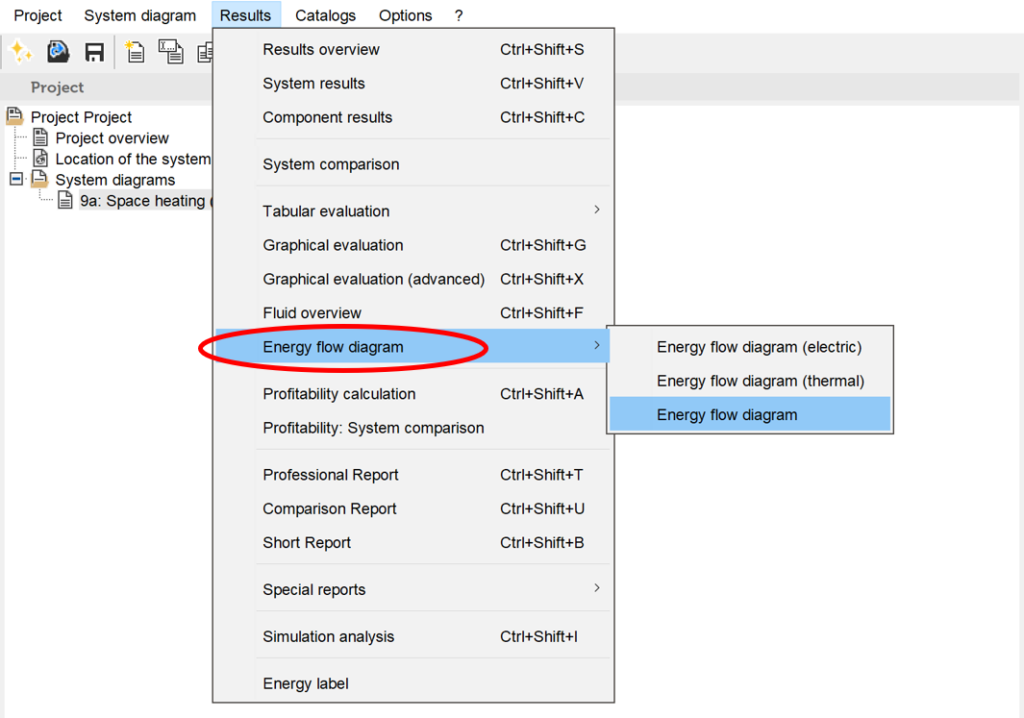
The energy flow diagram is a graphical representation of the energy balance of the designed system. It can be opened in the ‘Results’ tab or by the keyboard command Ctrl+Shift+E.
The energy flow diagram shows the energy inflows on the left hand side and its distribution on the right hand side. On the inflow side – heat generated to the system, e.g. from solar collector field. On the distribution side – demands and losses of the system. Both thermal energy and electrical energy are considered. For some hydraulic systems the energy flow diagram can not be displayed, e.g. borehole regeneration. The reason is that the energy flow balance can not always be calculated.
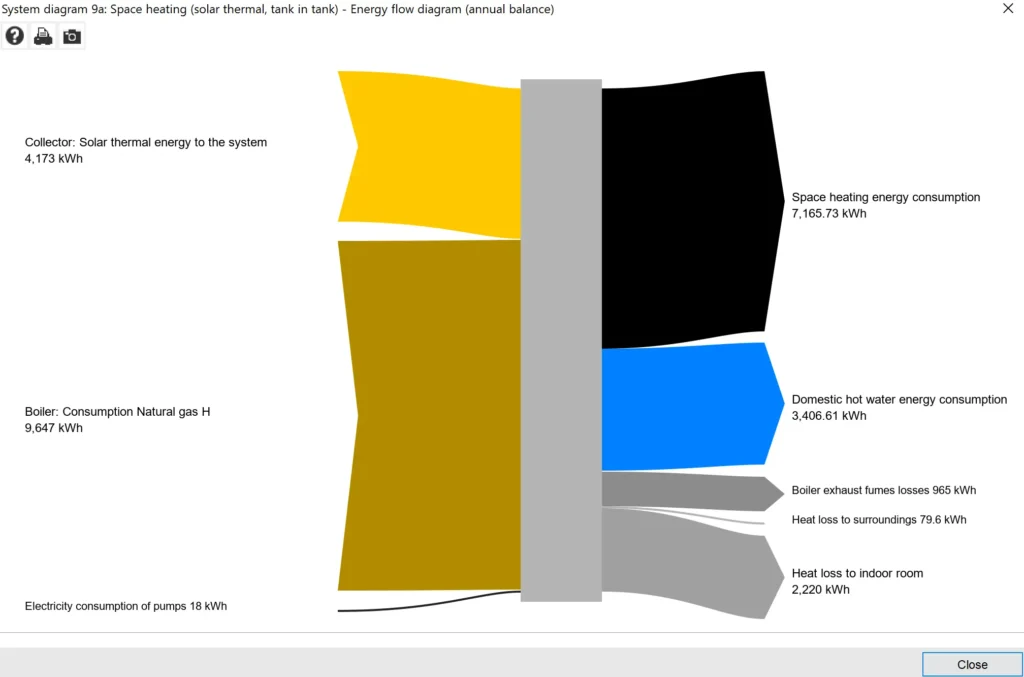
In order to view what each arrow on the diagram stands for, move the mouse over it to see the description.
The Energy Flow Diagram can be saved as an image or printed out using the buttons on the top left corner of the window.