Battery Lifetime Estimation
The ROI (Return of Investment) of batteries depends on their lifetime, which on the one hand depends on the battery’s wear and tear (cycle life), and on the other hand depends on time (calendar life). The cycle life can be estimated based on the number of charge/discharge cycles, which are counted (e.g., using the “Rainflow Cycle” counting method). The calendar life as well as the relationship between the depth of cycle (depth of discharge) and the number of cycles to failure is often presented in the battery’s datasheet (see the following figure).
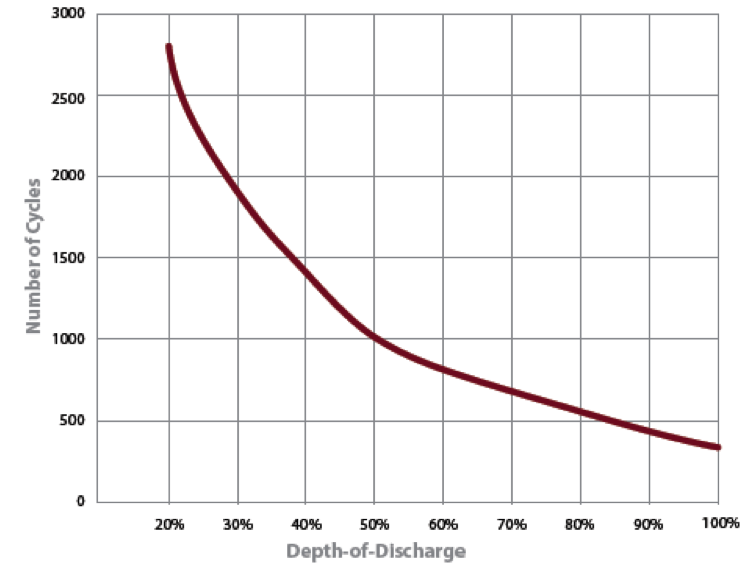
In Polysun, the relationship between the number of cycles to failure and the depth of discharge is modelled via one of two functions:
- As a double exponential function (suitable for lead batteries)
\(C_{F} = \alpha_{1} + \alpha_{2} \cdot e^{- \alpha_{3} \cdot DoD} + \alpha_{4}{\cdot e}^{- \alpha_{5} \cdot DoD}\)
- As a Wohler curve (suitable for lithium ion batteries)
\(C_{F} = \alpha_{1} \cdot DoD^{- \alpha_{2}}\)
The parameters \(\alpha_{1}\) to \(\alpha_{5}\) can be directly provided by the battery manufacturer or obtained via non-linear regression on empirical lifetime test data as shown in the datasheet charts[1]. All parameters are optional. However, no lifetime estimation can be made if they are not available. If only the parameters \(\alpha_{1}\ \) and \(\alpha_{5}\ \) are given, the Wohler curve is modelled. Otherwise, the double exponential function is used.
To compute the cycle life in Polysun, 20 histogram bins of equal size are used, each tallying the number of cycles of the respective range \(DoD\ \) range \(R\). \(M_{i}\) denotes the annual number of cycles with the range \(R_{i}\). \(C_{FL,i}\) denotes the respective number of cycles to failure of a range \(R_{i}\). With each battery cycle, \({1/C}_{FL,i}\) of the battery’s lifetime is exhausted. Therefore, the cumulative annual damage \(D\) is determined by:
\(D = \sum_{i}^{}\frac{M_{i}}{C_{FL,i}\ }\)
For instance, if at the end of the annual simulation, \(D = 0.5\), the battery is half-way through its cycle lifetime. In other words, the battery will need to be replaced every two years. Since a battery’s lifetime is drastically affected by deep discharge cycles, only part of the available capacity is used for daily cycling. The battery is never discharged deeper than \({SOC}_{\min}\). A \(SOC \geq {SOC}_{\min}\) constraint applies. The \({SOC}_{\min}\) value is type-specific and can be obtained form the manufacturer’s data sheet.
Simulation results for the batteries show both the total number of cycles run and the deep cycles. In the battery properties dialogue box, a deep cycle threshold defines what may be classified as “deep discharge”.
The total life \(L_{tot}\ \) of the battery is equal to the minimum of the calendar life \(L_{cal}\ \) and the cycle life \(L_{cyc}\):
\(L_{tot} = \min{(L_{cal,\ }L_{cyc})}\)
If no calendar life is given in the respective battery catalog entry, the following values are assumed: 20 years for lithium ion-, vanadium redox flow- and NiCd batteries, and 10 years for lead and NiMH batteries.
[1] For example, using Excel, Matlab or an online tool such as zunzun.com