Simulation Analysis
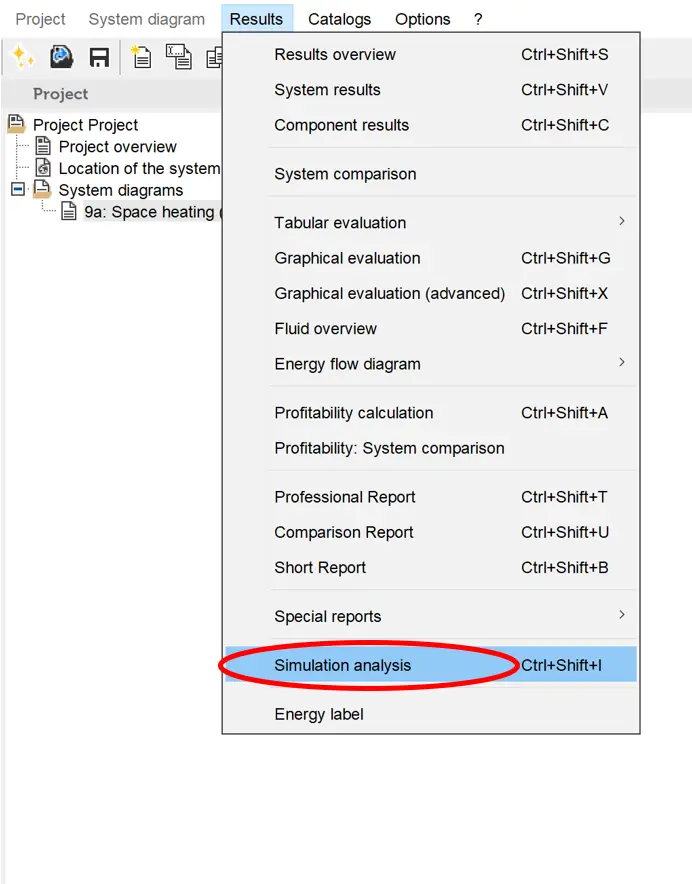
The Simulation Analysis can be opened in the ‘Results’ tab or by the keyboard command Ctrl+Shift+I.
The simulation analysis allows to see the change in the main parameters for each system component based on the time steps during the year. For each system component, the main results are shown (e.g. storage tank – temperature in each layer, solar collector field – total radiation onto collector aperture area and outflow temperature). You can go through every time step by clicking “+”, or use the arrow keys to go through the time steps: arrow = 1 time step, control key + arrow = 10 time steps, shift key + arrow = 100 time steps.
On each step you can see also in the window the date, current time and the serial number of the simulation step.
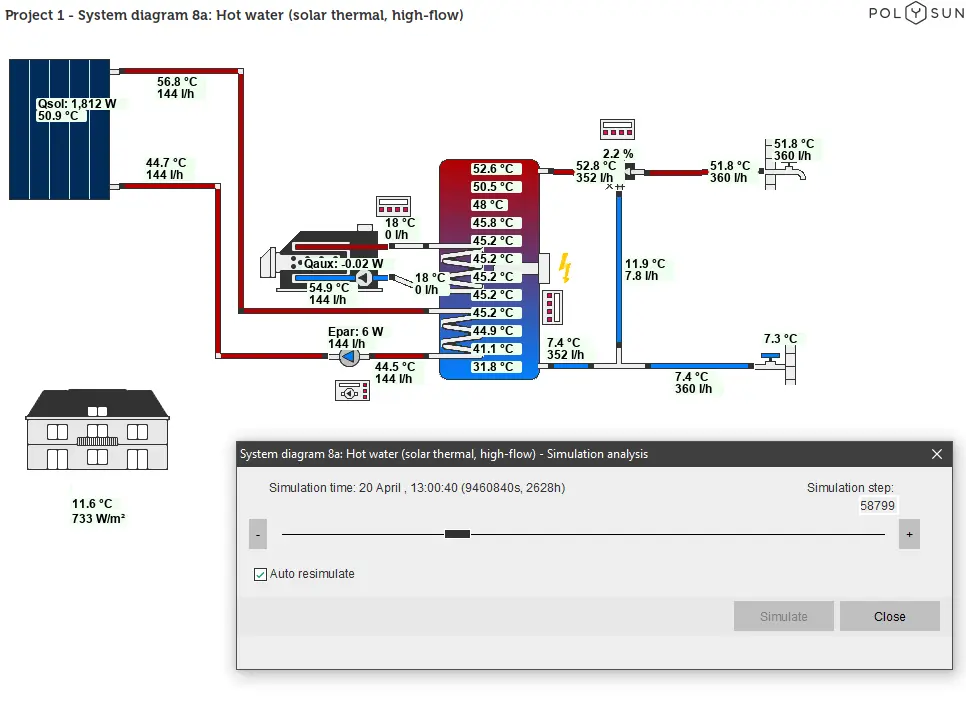
The presence of flow in the pipes is indicated by red color for relatively hot water and by blue color for the relatively cold water.
Video: Simulation analysis